5 GOSeq
5.1 Content of this script
In this script, we will do the following two things:
Based on the results of differential expression analysis, generated with voom/limma, DESeq2 and, edgeR, we will go through all steps required to run GOSeq.
We will go through all (meaningful) researchers’ degrees of freedom.
5.2 Libraries
All necessary packages are available on Bioconductor, and should be installed from there if not already available on your machine.
install.packages("BiocManager")
BiocManager::install("tweeDEseqCountData")
BiocManager::install("Biobase")
BiocManager::install("goseq")
Load libraries
library(tweeDEseqCountData)
library(Biobase)
library(goseq)
Description of the libraries:
tweeDEseqCountData: In addition to the results of differential expression analysis, we also need the raw count data for the case that we want to adjust the bias to account for (see step 4 of ‘Researcher’s degrees of freedom’ at the end of this script).
Biobase: Required to access the count data of the pickrell data set.
goseq: Offers the implementation of the method GOSeq.
5.3 Load data
The starting point of GOSeq are the results of differential expression analysis. Since GOSeq works with Ensembl gene IDs, we load the corresponding results of differential expression analysis with Ensembl gene IDs.
load("./data/Results_Differential_Expression_Analysis/DE_results_limma_Ensembl.Rdata")
load("./data/Results_Differential_Expression_Analysis/DE_results_DESeq2_Ensembl.Rdata")
load("./data/Results_Differential_Expression_Analysis/DE_results_edgeR_Ensembl.Rdata")
Since the relevant columns from the results table are unified for all three methods of differential expression analysis, the subsequent steps are identical for each results table. Therefore, we arbitrarily proceed with only one results table of differential expression analysis, namely DESeq2.
For a simplified readability, we store the corresponding results in an object with a more neutral name:
DE_results <- DE_results_DESeq2_EnsemblNote that you could easily change to one of the results tables of voom/limma or edgeR:
# DE_results <- DE_results_limma_Ensembl
# or
# DE_results <- DE_results_DESeq2_Ensembl
As mentioned above, we need the expression measurements of the pickrell data set for one of the researchers’ degrees of freedom.
5.4 Gene Set Analysis
5.4.1 Step 1: Preparation of required input object
GOSeq’s required input object differs from the objects typically required by ORA tools. Instead of a list of differentially expressed genes, GOSeq accepts as input a “named binary vector” with
values 0 (for not differentially expressed genes) and 1 (for differentially expressed genes).
names that correspond to the associated gene IDs.
Note that some methods for differential expression analysis, such as DESeq2, set the adjusted p-values of some genes to NA. This means that these genes are not assessed with respects to differential expression. Consequently, these genes cannot be assigned neither value 1 nor 0 in the input object. We therefore remove genes with an adjusted p-value set to NA from the creation of the named binary vector.
# 1. for each gene from the experiment, indicate those that have an EXISTING (i.e.
# NON-MISSING) p-value
indicator_nonNA_p <- !is.na(DE_results$p_adj)

# 2. using the indicator from 1., subset the results of differential expression
# analysis to only those genes with an EXISTING (i.e. NON-MISSING) p-value
DE_results_noNA <- DE_results[indicator_nonNA_p,]

# 3. create vector with binary value (0 or 1) for each gene in DE_results_noNA
# for this, we focus on the column p_adj which contains the adjusted p-values
bin_vec_DEG <- ifelse(DE_results_noNA$p_adj < 0.05 , 1,0)

# note: function ifelse() goes through each adjusted p-value in the results
# of differential expression analysis and in a new vector, assigns value 1
# if the adjusted p-value is < 0.05 and else value 0

# 4. assign each value of the vector the corresponding gene ID
names(bin_vec_DEG) <- rownames(DE_results_noNA)

# 5. results: named binary vector bin_vec_DEG
# note that we here inspect only the first few entries
head(bin_vec_DEG, n = 20)
#> ENSG00000000419 ENSG00000000457 ENSG00000000460
#>               0               0               0
#> ENSG00000000938 ENSG00000001036 ENSG00000001167
#>               0               0               0
#> ENSG00000001497 ENSG00000001561 ENSG00000002016
#>               0               0               0
#> ENSG00000002330 ENSG00000002587 ENSG00000002745
#>               0               0               0
#> ENSG00000002834 ENSG00000002919 ENSG00000003056
#>               0               0               0
#> ENSG00000003096 ENSG00000003249 ENSG00000003989
#>               0               0               0
#> ENSG00000004468 ENSG00000004478
#>               0               0
Note that “bin_vec_DEG” stands for binary vector of differentially expressed genes.
For illustration purposes: compare the number of differentially expressed genes from the results table of differential expression analysis to the number of differentially expressed genes from the named binary vector.
# (i) initial results table of differential expression analysis
table(DE_results$p_adj < 0.05)
#>
#> FALSE  TRUE
#> 10128    22

# (ii) results table of differential expression analysis subsetted to those genes
# with a non-missing adjusted p-value
table(DE_results_noNA$p_adj < 0.05)
#>
#> FALSE  TRUE
#> 10128    22

# (iii) named binary vector
table(bin_vec_DEG)
#> bin_vec_DEG
#>     0     1
#> 10128    22
5.4.2 Step 2: Calculate probability weight for each gene
GOSeq works with the function nullp() to calculate the probability weight of each gene:
For an overview of available gene identifiers and supported organisms see:
Function arguments:
DEgenes: named binary vector generated in step 1
-
genome: indicates organism from which gene expression is measured
specify ‘organism = “hg19”’ for human
for other organisms, the argument must be adapted accordingly (such as “mm9” for mouse)
-
id: indicates gene identifier
specify ‘id = “knownGene”’ for Entrez gene ID
specify ‘id = “ensGene”’ for Ensembl gene ID (which is the case here)
specify ‘id = “geneSymbol”’ for HGNC gene symbols
Note 1: Argument bias.data specifies the data on which the detection of differential expression might be dependent on. While the default argument ‘bias.data = NULL’ specifies that the length of each gene is retrieved from the UCSC genome browser, the user can alternatively provide a vector which contains an entry for each gene contained by bin_vec_DEG. An alternative suggested by the authors of GOSeq would be to account for the read count bias of each gene, i.e. for the total number of read counts across all samples that are assigned to each individual gene.
Note 2: By default, the probability weight function is plotted when nullp() is run. This can be deactivated by adding the function argument ‘plot.fit = FALSE’.
ProbabilityWeightings <- nullp(DEgenes = bin_vec_DEG,
             genome= "hg19",
             id= "ensGene")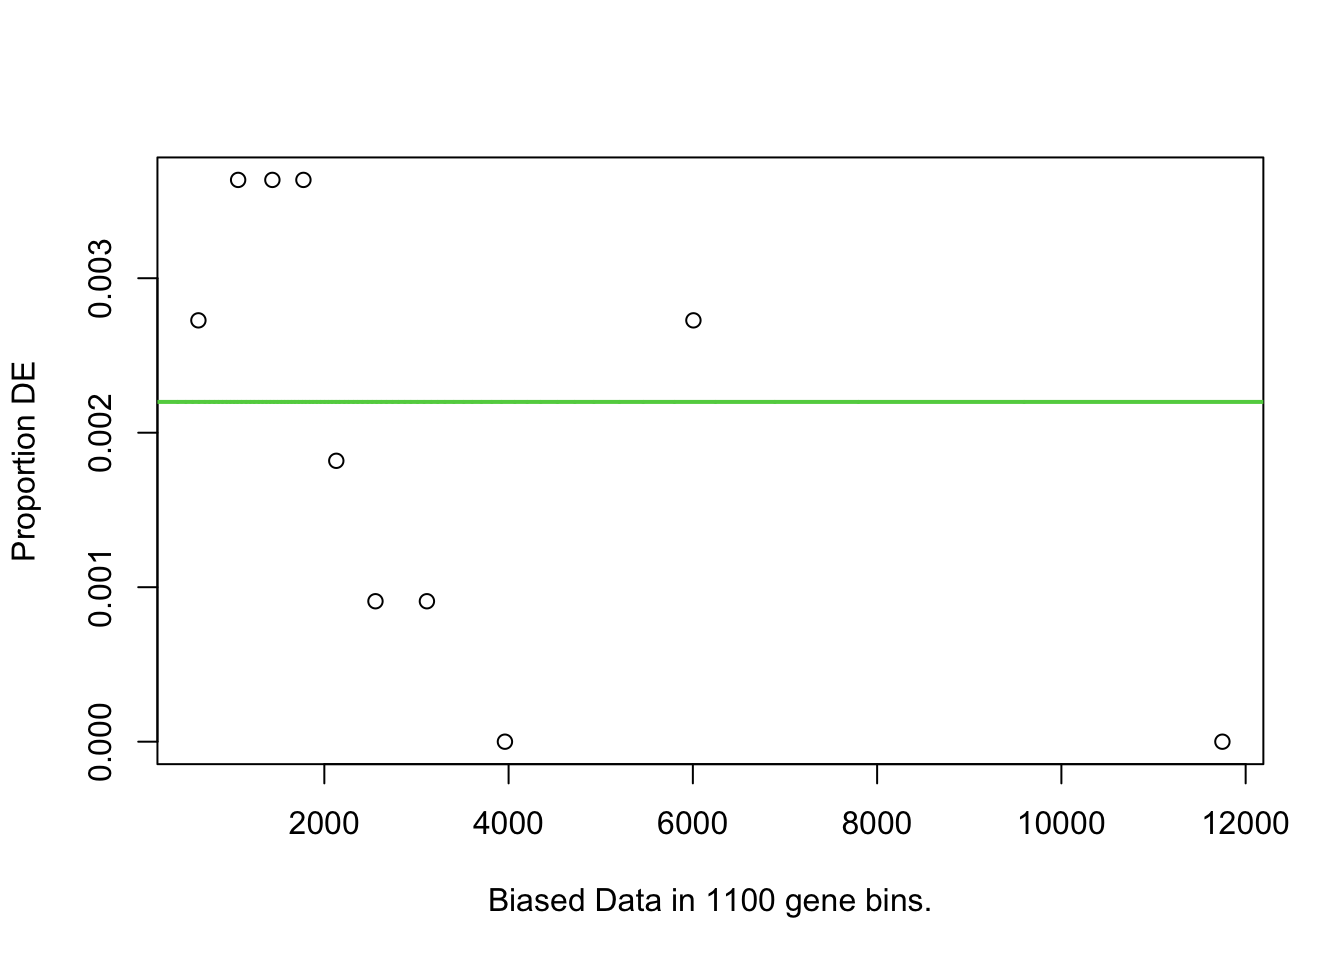
Inspect the resulting data frame:
head(ProbabilityWeightings, n = 10)
#>                 DEgenes bias.data        pwf
#> ENSG00000000419       0    1079.5 0.00219934
#> ENSG00000000457       0    3128.5 0.00219934
#> ENSG00000000460       0    3126.0 0.00219934
#> ENSG00000000938       0    2437.0 0.00219934
#> ENSG00000001036       0    1365.0 0.00219934
#> ENSG00000001167       0    6140.0 0.00219934
#> ENSG00000001497       0    2398.5 0.00219934
#> ENSG00000001561       0    4590.5 0.00219934
#> ENSG00000002016       0    2712.5 0.00219934
#> ENSG00000002330       0    1074.0 0.00219934
The results table of nullp() provides one row of data for each gene with the following information:
DEgenes: indicates status of differential expression (0/1). This information can be directly extracted from the input object
bias.data: numeric value of bias for each gene concerning the detection of differential expression. This usually corresponds to the length of the gene
pwf: value of the probability weighting function of the gene
Note that the values of bias.data in the resulting data frame depend on the function argument bias.data in function nullp() (further information below).
5.4.3 Step 3: Test for differential enrichment
GOSeq_results <- goseq(pwf = ProbabilityWeightings,
                       genome = "hg19",
                       id = "ensGene",
                       test.cats = "GO:BP")
Function arguments:
-
pwf: typically the output of the nullp() function (step 2), i.e. probability weighting function genome: indicates organism from which gene expression is measured (see also step 2)
specify organism = “hg19” for human
for other organisms, the argument must be adapted accordingly (such as “mm9” for mouse)
-
id: indicates gene identifier (see also step 2)
specify ‘id = “knownGene”’ for Entrez gene ID
specify ‘id = “ensGene”’ for Ensembl gene ID
specify ‘id = “geneSymbol”’ for HGNC gene symbols
-
test.cats: gene set database
5.4.4 Step 4: Adjust for multiple testing
Note that GOSeq does not perform adjustment for multiple testing internally so that it MUST be performed by the user manually. We therefore add a new column that contains the corresponding adjusted p-values. Relevant for the over-representation test are the (unadjusted) p-values from column “over_represented_pvalue” which we adjust for multiple testing in the following:
GOSeq_results$p_adj_overrepresented <- p.adjust(GOSeq_results$over_represented_pvalue)Note that by default, p.adjust() (from library base) performs multiple test adjustment based on the method by Benjamini and Hochberg.
5.4.5 Step 5: Interpretation of the results table
Inspect final results table:
head(GOSeq_results, n = 10)
#>        category over_represented_pvalue
#> 9794 GO:0072132             0.001436536
#> 8615 GO:0060806             0.001966139
#> 3792 GO:0030036             0.003004745
#> 5449 GO:0035965             0.003928626
#> 6217 GO:0043503             0.003928626
#> 9544 GO:0071557             0.003928626
#> 3786 GO:0030029             0.004596282
#> 2746 GO:0010957             0.005887469
#> 8611 GO:0060800             0.005887469
#> 9365 GO:0071205             0.005887469
#>      under_represented_pvalue numDEInCat numInCat
#> 9794                0.9999774          2       29
#> 8615                1.0000000          1        1
#> 3792                0.9997067          4      319
#> 5449                0.9999963          1        2
#> 6217                0.9999963          1        2
#> 9544                0.9999963          1        2
#> 3786                0.9994938          4      359
#> 2746                0.9999891          1        3
#> 8611                0.9999891          1        3
#> 9365                0.9999891          1        3
#>                                                                                        term
#> 9794                                                               mesenchyme morphogenesis
#> 8615 negative regulation of cell differentiation involved in embryonic placenta development
#> 3792                                                        actin cytoskeleton organization
#> 5449                                                      cardiolipin acyl-chain remodeling
#> 6217                                                       skeletal muscle fiber adaptation
#> 9544                                                           histone H3-K27 demethylation
#> 3786                                                           actin filament-based process
#> 2746                                  negative regulation of vitamin D biosynthetic process
#> 8611          regulation of cell differentiation involved in embryonic placenta development
#> 9365                                   protein localization to juxtaparanode region of axon
#>      ontology p_adj_overrepresented
#> 9794       BP                     1
#> 8615       BP                     1
#> 3792       BP                     1
#> 5449       BP                     1
#> 6217       BP                     1
#> 9544       BP                     1
#> 3786       BP                     1
#> 2746       BP                     1
#> 8611       BP                     1
#> 9365       BP                     1
Columns in results table:
Category: provides the ID of the gene set (based on the choice of the gene set database in step 4)
-
over_represented_pvalue: p-value of over-representation
- IMPORTANT NOTE: DO NOT use these p-values to assess differential enrichment of a given gene set, since these p-value have not been adjusted for multiple testing
-
under_represented_p-value: p-value of under-representation
not relevant if you want to test for over-representation
important note: if you are interested in testing for under-representation, you must adjust the p-values for multiple testing:
#GOSeq_results$p_adj_underrepresented <- p.adjust(GOSeq_results$under_represented_pvalue)numDEInCat: gives the number of differentially expressed genes from the input that are members of the given gene set
numInCat: number of genes that are members of the given gene set
-
term: description of the gene set
- NOTE: this column is only provided for the geneset database GO
-
ontology: subontology of geneset database GO (based on choice in step 3)
- this column is only provided for the geneset database GO
-
p_adj_overrepresented: p-value of over-representation that has been ADJUSTED for multiple testing
- based on these adjusted p-values, differential enrichment (i.e. significant over-representation) can be assessed
typically: detect those gene sets as differentially enriched with a value of p_adj_overrepresented < 0.05
5.5 Researchers’ degrees of freedom
In this part, we will go through all parameters that can be adapted in the GOSeq workflow. It is important to note that the intention behind going through the researchers’ degrees of freedom is to give you an understanding of what you can do to adapt the given (parameter) setting to the research question. It is even more important to keep in mind that the intention behind going through these flexible parameters is NOT to change them in order to help you obtain the most preferable results by systematically changing these parameters since such behaviour would correspond to “cherry-picking”. Any changes in the parameter choice must be documented transparently.
5.5.1 Change 1: Change gene set database
The gene set database can be adjusted in the function goseq() in argument test.cats, while the arguments and therefore also the results of function nullp() remain untouched.
Here, we want to change the gene set database to KEGG
GOSeq_results_database <- goseq(pwf = ProbabilityWeightings,
                                genome = "hg19",
                                id = "ensGene",
                                test.cats = "KEGG")


# adjust the p-values of over-representation for multiple testing
GOSeq_results_database$p_adj_overrepresented <- p.adjust(GOSeq_results_database$over_represented_pvalue)
Inspect the results
head(GOSeq_results_database, n = 10)
#>     category over_represented_pvalue
#> 15     00140              0.05639237
#> 74     00830              0.07679025
#> 112    04115              0.10664353
#> 137    04520              0.12606006
#> 131    04360              0.17902850
#> 110    04110              0.19106380
#> 138    04530              0.19404770
#> 87     03010              0.20294007
#> 118    04142              0.22908991
#> 88     03013              0.24046217
#>     under_represented_pvalue numDEInCat numInCat
#> 15                 0.9986285          1       16
#> 74                 0.9973902          1       22
#> 112                0.9948370          1       31
#> 137                0.9926905          1       37
#> 131                0.9848017          1       54
#> 110                0.9825791          1       58
#> 138                0.9820026          1       59
#> 87                 0.9802242          1       62
#> 118                0.9744602          1       71
#> 88                 0.9716992          1       75
#>     p_adj_overrepresented
#> 15                      1
#> 74                      1
#> 112                     1
#> 137                     1
#> 131                     1
#> 110                     1
#> 138                     1
#> 87                      1
#> 118                     1
#> 88                      1
Note that when the gene set database KEGG is specified, then no column “term” is provided in the results table to give a description of the corresponding gene set.
Other gene set databases can be specified by setting the argument to
5.5.2 Change 2: Include genes that are no member of any gene set in calculation of the p-value
By default, only those gene sets are included in the calculation of the p-value that are a member to at least one gene set. However, the user has the choice to include all genes from the input object, thus particularly those that are no member of any gene set.
The additional inclusion of those genes that are no members of any gene set can by specified in argument use_genes_without_cat in function goseq().
GOSeq_results_allgenes <- goseq(pwf = ProbabilityWeightings,
                                    genome = "hg19",
                                    id = "ensGene",
                                    test.cats = "GO:BP",
                                    use_genes_without_cat = TRUE)

# adjust the p-values of over-representation for multiple testing
GOSeq_results_allgenes$p_adj_overrepresented <- p.adjust(GOSeq_results_allgenes$over_represented_pvalue)
Inspect the results
head(GOSeq_results_allgenes, n = 10)
#>        category over_represented_pvalue
#> 9794 GO:0072132             0.001757439
#> 8615 GO:0060806             0.002167488
#> 5449 GO:0035965             0.004330490
#> 6217 GO:0043503             0.004330490
#> 9544 GO:0071557             0.004330490
#> 3792 GO:0030036             0.004473754
#> 2746 GO:0010957             0.006489017
#> 8611 GO:0060800             0.006489017
#> 9365 GO:0071205             0.006489017
#> 3786 GO:0030029             0.006791812
#>      under_represented_pvalue numDEInCat numInCat
#> 9794                0.9999689          2       29
#> 8615                1.0000000          1        1
#> 5449                0.9999955          1        2
#> 6217                0.9999955          1        2
#> 9544                0.9999955          1        2
#> 3792                0.9994964          4      319
#> 2746                0.9999866          1        3
#> 8611                0.9999866          1        3
#> 9365                0.9999866          1        3
#> 3786                0.9991380          4      359
#>                                                                                        term
#> 9794                                                               mesenchyme morphogenesis
#> 8615 negative regulation of cell differentiation involved in embryonic placenta development
#> 5449                                                      cardiolipin acyl-chain remodeling
#> 6217                                                       skeletal muscle fiber adaptation
#> 9544                                                           histone H3-K27 demethylation
#> 3792                                                        actin cytoskeleton organization
#> 2746                                  negative regulation of vitamin D biosynthetic process
#> 8611          regulation of cell differentiation involved in embryonic placenta development
#> 9365                                   protein localization to juxtaparanode region of axon
#> 3786                                                           actin filament-based process
#>      ontology p_adj_overrepresented
#> 9794       BP                     1
#> 8615       BP                     1
#> 5449       BP                     1
#> 6217       BP                     1
#> 9544       BP                     1
#> 3792       BP                     1
#> 2746       BP                     1
#> 8611       BP                     1
#> 9365       BP                     1
#> 3786       BP                     1
Note that the argument ‘use_genes_without_cat = TRUE’ used to be the default in earlier versions of the library goseq.
5.5.3 Change 3: Change the method for the calculation of the p-value
The method for the calculation of the p-value can be adapted in function goseq() in the argument method.
Here, we want to change the method for the calculation of the p-value from Wallenius approximation to the computationally expensive resampling.
GOSeq_results_method <- goseq(pwf = ProbabilityWeightings,
                              genome = "hg19",
                              id = "ensGene",
                              test.cats = "GO:BP",
                              method = "Sampling")


# adjust the p-values of over-representation for multiple testing
GOSeq_results_method$p_adj_overrepresented <- p.adjust(GOSeq_results_method$over_represented_pvalue)
Inspect the results
head(GOSeq_results_method, n = 10 )
#>        category over_represented_pvalue
#> 9794 GO:0072132             0.001499250
#> 3792 GO:0030036             0.001999000
#> 8615 GO:0060806             0.001999000
#> 3786 GO:0030029             0.002498751
#> 5449 GO:0035965             0.003998001
#> 6217 GO:0043503             0.004497751
#> 3962 GO:0030833             0.005497251
#> 9365 GO:0071205             0.005497251
#> 1733 GO:0007015             0.005997001
#> 2001 GO:0008064             0.005997001
#>      under_represented_pvalue numDEInCat numInCat
#> 9794                        1          2       29
#> 3792                        1          4      319
#> 8615                        1          1        1
#> 3786                        1          4      359
#> 5449                        1          1        2
#> 6217                        1          1        2
#> 3962                        1          2       62
#> 9365                        1          1        3
#> 1733                        1          3      210
#> 2001                        1          2       71
#>                                                                                        term
#> 9794                                                               mesenchyme morphogenesis
#> 3792                                                        actin cytoskeleton organization
#> 8615 negative regulation of cell differentiation involved in embryonic placenta development
#> 3786                                                           actin filament-based process
#> 5449                                                      cardiolipin acyl-chain remodeling
#> 6217                                                       skeletal muscle fiber adaptation
#> 3962                                            regulation of actin filament polymerization
#> 9365                                   protein localization to juxtaparanode region of axon
#> 1733                                                            actin filament organization
#> 2001                                 regulation of actin polymerization or depolymerization
#>      ontology p_adj_overrepresented
#> 9794       BP                     1
#> 3792       BP                     1
#> 8615       BP                     1
#> 3786       BP                     1
#> 5449       BP                     1
#> 6217       BP                     1
#> 3962       BP                     1
#> 9365       BP                     1
#> 1733       BP                     1
#> 2001       BP                     1
Note that by default, 2000 samples are calculated in the course of resampling (see argument repcnt). This argument should NEVER be played around with to generate preferable results. Instead, it is advisable to keep this parameter in its default configuration.
Also note that, theoretically, GOSeq additionally offers the use of the standard hypergeometric distribution as the method to calculate a p-value of over-representation. However, users are explicitly advised against using this option since the standard hypergeometric distribution does not adjust for ANY biases that might be present in the data.
5.5.4 Change 4: Change the bias to account for in the analysis
As an example taken from the user manual of GOSeq, we now want to adjust for the total number of counts of each gene. The idea behind this is that in the context of RNA-Seq data, the magnitude of counts of a given gene set reflects its overall expression level. In RNA-Seq data, which takes the form of count data, a higher magnitude of counts also leads to an increased statistical power (to detect a gene as differentially expressed), which shall be accounted for now. It is important to note that accounting for the total number of counts might also remove the bias that results from actual differential expression between both conditions.
Step 1: create a vector that contains the total number of read counts for each gene
# 1. Compute the sum of read counts of each gene across all samples from the gene expression data set
countbias <- rowSums(expression_data)

# 2. Subset the vector countbias to all genes that are part of the input object bin_vec_DEG

# (i) indicate which genes are a part of the input object:
ind_input <- names(countbias) %in% names(bin_vec_DEG)

# (ii) subset vector countbias
countbias <- countbias[ind_input]
Step 2: Provide countbias to function nullp()
The custom bias can be provided to function nullp() in argument bias.data:
ProbabilityWeightings_countbias <- nullp(DEgenes = bin_vec_DEG,
                                        genome= "hg19",
                                        id= "ensGene",
bias.data = countbias) 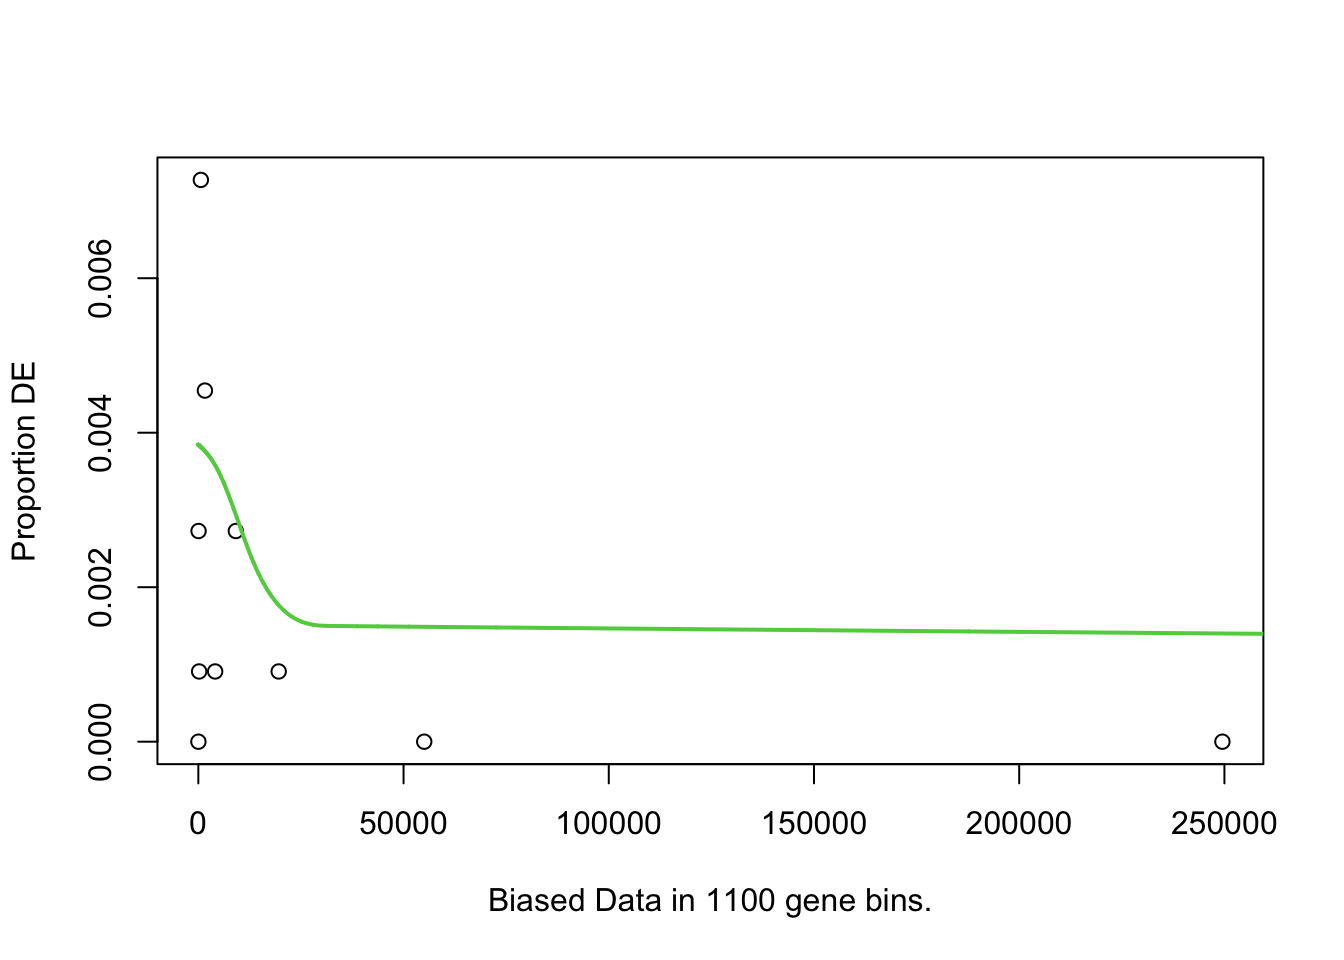
Step 3: Run function goseq() with adjusted probability weightings
GOSeq_results_countbias <- goseq(pwf = ProbabilityWeightings_countbias, # adjusted probability weightings
                                 genome = "hg19",
                                 id = "ensGene",
                                 test.cats = "GO:BP")
#> Fetching GO annotations...
#> For 995 genes, we could not find any categories. These genes will be excluded.
#> To force their use, please run with use_genes_without_cat=TRUE (see documentation).
#> This was the default behavior for version 1.15.1 and earlier.
#> Calculating the p-values...
#> 'select()' returned 1:1 mapping between keys and
#> columns
Step 4: Perform adjustment for multiple testing and inspect final results
GOSeq_results_countbias$p_adj_overrepresented <- p.adjust(GOSeq_results_countbias$over_represented_pvalue)Step 5: Inspect the results
head(GOSeq_results_countbias, n = 10)
#>        category over_represented_pvalue
#> 9794 GO:0072132             0.001651374
#> 8615 GO:0060806             0.002373709
#> 3792 GO:0030036             0.002652747
#> 9544 GO:0071557             0.003349445
#> 3786 GO:0030029             0.004301984
#> 5449 GO:0035965             0.004806876
#> 6217 GO:0043503             0.004827855
#> 3962 GO:0030833             0.005561337
#> 9365 GO:0071205             0.005738523
#> 2050 GO:0008360             0.006366822
#>      under_represented_pvalue numDEInCat numInCat
#> 9794                0.9999721          2       29
#> 8615                1.0000000          1        1
#> 3792                0.9997499          4      319
#> 9544                0.9999973          1        2
#> 3786                0.9995350          4      359
#> 5449                0.9999945          1        2
#> 6217                0.9999945          1        2
#> 3962                0.9998202          2       62
#> 9365                0.9999896          1        3
#> 2050                0.9997791          2       64
#>                                                                                        term
#> 9794                                                               mesenchyme morphogenesis
#> 8615 negative regulation of cell differentiation involved in embryonic placenta development
#> 3792                                                        actin cytoskeleton organization
#> 9544                                                           histone H3-K27 demethylation
#> 3786                                                           actin filament-based process
#> 5449                                                      cardiolipin acyl-chain remodeling
#> 6217                                                       skeletal muscle fiber adaptation
#> 3962                                            regulation of actin filament polymerization
#> 9365                                   protein localization to juxtaparanode region of axon
#> 2050                                                               regulation of cell shape
#>      ontology p_adj_overrepresented
#> 9794       BP                     1
#> 8615       BP                     1
#> 3792       BP                     1
#> 9544       BP                     1
#> 3786       BP                     1
#> 5449       BP                     1
#> 6217       BP                     1
#> 3962       BP                     1
#> 9365       BP                     1
#> 2050       BP                     1